Gravel is a C++ library with Python bindings for network graph fragility analysis. Released under Apache 2.0. Built-in loaders for OpenStreetMap road data, but the fragility engine operates on any directed weighted graph, applicable to electrical grids, telecom networks, water systems, or arbitrary graphs supplied from an edge list.
Published · v3.1.0
Gravel
Network graph fragility analysis. Given a graph and a notion of "failure,"
Gravel quantifies how badly connectivity degrades: which edges are load-bearing,
which regions become isolated, and where redundancy is genuinely absent versus
merely reduced. Ships with first-class OpenStreetMap support for road networks;
the analysis engine itself works on any directed weighted graph. Now it renders
those failures too, not just scores them: interactive flood-risk maps that play a
road network coming apart as the water rises.
Apache 2.0C++20Python 3.10+Linux · macOS · Windows
Fragility used to be a number Gravel returned. As of 2.5.0 it's something you can
watch: a visualization layer, a built-in FEMA flood-hazard pipeline, and six
analysis hot paths moved into the C++ engine behind the same Python API.
Static colorblind-safe choropleths for the paper, WebGL maps that scale to
county-size networks, and self-contained animated dashboards that play the
failure sequence in any browser. No server, no notebook kernel.
FEMA flood data, built in
fetch_nfhl_flood_zones pulls live hazard polygons from FEMA's
National Flood Hazard Layer; flood_edge_probabilities turns them
into per-edge closure probabilities that feed the fragility model.
Three-state coloring
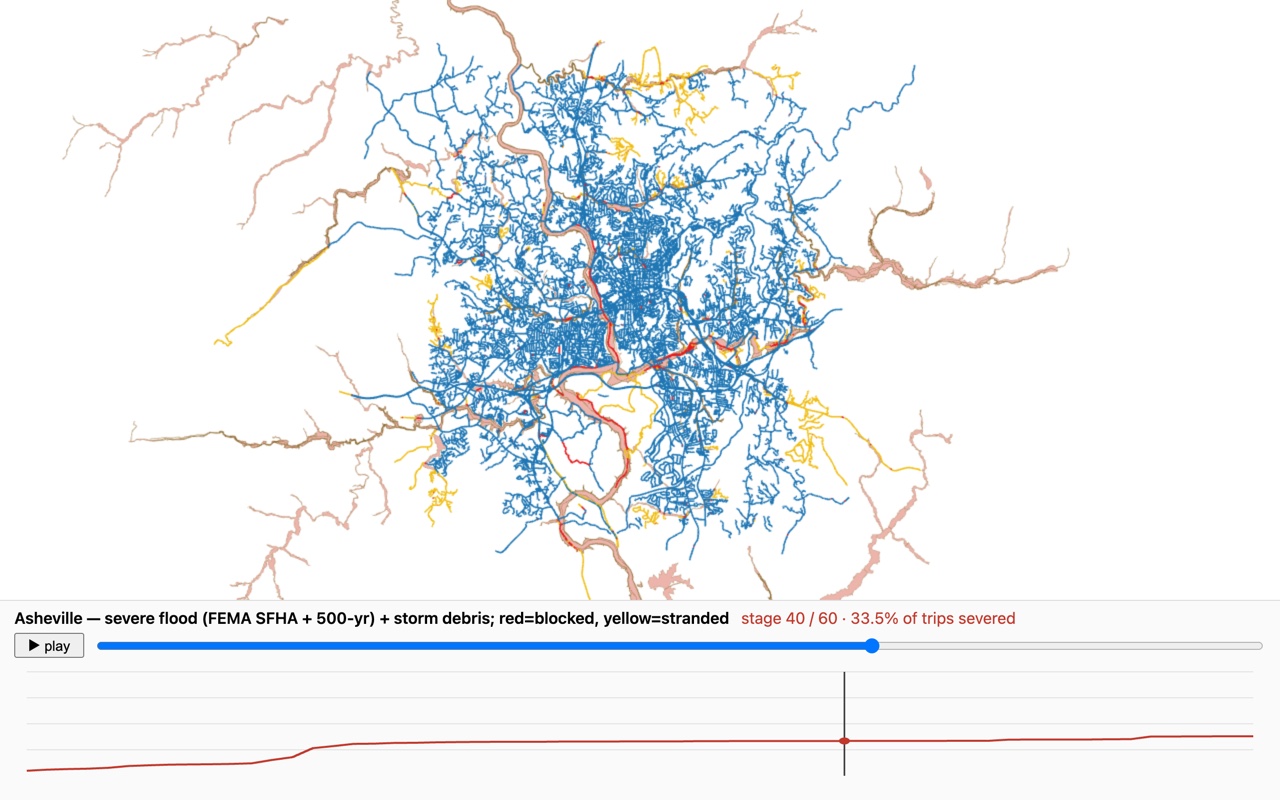
Roads directly blocked (red) are separated from roads left stranded (yellow)
over the still-connected network (blue), so amplification is visible: a handful
of flooded crossings isolate a far larger dry area than they physically touch.
Real road geometry
Simplified graphs now carry the true road polyline, so maps trace actual roads
instead of straight lines between intersections. A geometry tolerance downscales
it natively for smaller share files.
What fragility looks like
Two neighborhoods of nodes joined by a single load-bearing edge. Routing sees a
connected graph and a shortest path; fragility analysis sees the one link whose
failure strands everything behind it.
The same one-edge dependency hides in a road network (a single bridge), a power
grid (one substation), and a telecom backbone (one fiber run). Gravel scores it the
same way in all three, a ranked answer to where is redundancy genuinely absent?
The question routing libraries don't ask
Traditional routing answers what is the shortest path? Gravel answers
a harder one: how does that path degrade when edges fail?
Why it matters
Critical-infrastructure plans assume networks stay functional under stress.
They rarely do. Constrained geographies (mountain passes, coastal corridors,
single-substation towns) depend on a handful of edges with no viable detours.
What Gravel produces
Quantitative fragility scores that make vulnerabilities comparable across
regions and domains, so "where is redundancy genuinely absent?" becomes
a ranked list, not a hunch or a tabletop guess.
Built for roads. Works on any network.
Gravel's analysis operates on a generic ArrayGraph: nodes, directed
weighted edges, optional coordinates. The road-specific parts (OSM PBF loading,
TIGER/Census boundaries, speed profiles) live in the gravel-geo and
gravel-us sub-libraries. Everything else (contraction hierarchies,
replacement-path analysis, isolation scoring, scenario fragility) doesn't care
what your edges represent.
Built-in
Road networks
OpenStreetMap PBF loader with configurable speed profiles. TIGER/Line loaders
for US counties, states, CBSAs. Emergency routing, evacuation planning,
bridge criticality, rural-access equity.
Bring your own
Electrical grids
Substations and generators as nodes; transmission lines as weighted edges
(impedance, capacity). Identify single-substation dependencies, model
cascade-failure propagation, rank blackout exposure by region.
Bring your own
Telecom networks
Routers, switches, and towers as nodes; fiber runs and microwave links as
edges (bandwidth, latency). Quantify fiber-cut impact, find routing-diversity
gaps, pre-position redundancy where it matters.
Bring your own
Water, gas, rail, custom
Any graph with nodes, weighted edges, and a notion of flow works. Load from
CSV edge lists, a NumPy array, or programmatic builders, no OSM dependency
required, no geography assumed.
Why this matters for disaster & national security planning
The networks a country depends on (power, communications, water, transport)
share the same underlying math. An edge fails; some set of downstream nodes
becomes harder or impossible to reach. Gravel lets you score that failure
quantitatively across domains using one toolkit, so comparative risk analysis
stops being apples-to-oranges.
Installation
conda, recommended
conda install -c conda-forge gravel-fragility
pip, source build
pip install gravel-fragility
Add the visualization + interop stack
pip install "gravel-fragility[viz,interop]"
Pulls in the static plots, WebGL maps, and self-contained dashboards
(viz.dashboard_html) plus the FEMA hazard loaders.
OSM loading requires libosmium. Install separately via
brew install libosmium on macOS or
apt install libosmium2-dev on Debian/Ubuntu. If you're bringing your
own graph and don't need OSM, skip it entirely: the core and fragility libraries
have no geographic dependencies.
Quick start
Three examples: a synthetic graph (no geography), a real OSM county, then a flood scenario rendered to a shareable dashboard.
Synthetic graph, any network
import gravel

# Build a 20×20 grid graph, 400 nodes, no geography
graph = gravel.make_grid_graph(20, 20)

# Contraction hierarchy: one-time cost, then O(log n) queries
ch = gravel.build_ch(graph)
query = gravel.CHQuery(ch)

# Shortest path from corner to corner
result = query.route(source=0, target=399)
print(f"distance: {result.distance:.2f}, "
      f"path: {len(result.path)} nodes")
Apple M-series laptop, 10 cores, release + OpenMP build. Real OSM data at two scales.
Operation
Swain · 200K nodes
Buncombe · 593K nodes
OSM PBF load
0.43 s
0.96 s
Contraction-hierarchy build
0.78 s
3.81 s
CH distance query
3.5 µs
7.8 µs
CH route (with path unpacking)
80.5 µs
112.8 µs
Distance-matrix cell (10 threads)
0.6 µs
1.3 µs
Route fragility (per path edge)
~13 ms
~28 ms
Location fragility (MC=20, 50-mi radius)
0.11 s
1.0 s
Swain Co. NC (200K nodes) and Buncombe Co. NC (593K nodes), real OSM data, 2026-07-01 baseline.
Flood-exposure pass228 msPer-edge flood probability across 101,760 edges and 250 FEMA zones (multi-zone point-in-polygon). It cost minutes in pure Python before 2.5.0.
Moved into C++6 kernelsAnalysis hot paths moved from Python into the engine behind identical wrappers. Same public API, just faster and more consistent.
Parallel scaling~5×The parallel kernels scale roughly 5× from 1 to 10 threads, memory-bandwidth-bound past about 4.
What the national run found
Running per-county isolation fragility across all 3,221 US counties produced
ranked results. Mean risk per state, April 2026 run.
Road-network isolation risk for every US county. Green is resilient, red is one closure from cut off. Hover any county for its name and score.
Most vulnerable states
New Hampshire0.638
Maine0.571
Rhode Island0.570
Connecticut0.563
Most resilient states
Kansas0.146
Nebraska0.162
Iowa0.163
North Dakota0.165
What the ranking tells you
The Great Plains grid-states score lowest: flat terrain and rectangular road
networks yield extensive redundancy. Mountain and coastal states score highest:
constrained geography forces traffic through single-path corridors. These are
the sort of patterns fragility analysis surfaces cleanly — not "this bridge is
old" but "these regions have no topological alternative."
Architecture
Six sub-libraries with a strict dependency DAG. Consumers link only what they
need: a router-only tool never pulls in Eigen, Spectra, or libosmium.
OSM loading, regions, snapping, boundary nodes (libosmium)
core, simplify
gravel-us
TIGER/Census loaders, FIPS crosswalk
geo
The key architectural choice
gravel-fragility does not depend on
gravel-geo. Road-specific and geography-specific code is isolated
to two leaf sub-libraries. The moment you bring your own graph, you drop those
dependencies and link against the domain-agnostic core.
Where it earns its keep
Emergency management
Pre-position by isolation risk
Rank every county or district by the fragility of its access routes.
Supply depots and response teams go where isolation is most likely,
not where a gut call sends them.
Infrastructure planning
Redundancy investment
Identify the edges that matter disproportionately, the bridge or
transmission line whose failure disconnects real populations, and
prioritize capital projects that buy the most resilience per dollar.
Critical infrastructure
National security assessment
Model cascade failure and single-point-of-failure exposure on power,
water, telecom, and transport networks using a consistent toolkit.
Comparative risk analysis across domains becomes a numerical exercise.
Transportation equity
Access gaps, quantified
Measure how dependent a community is on a single critical route.
Directional analysis reveals asymmetric vulnerabilities, the
evacuation-route problems that don't show up on a map.
Apache 2.0, free for commercial, research, and government use.
Contributions welcome via GitHub Issues and Pull Requests.
BibTeX
@software{gravel2026,
  author  = {Hoekstra, Robert},
  title   = {Gravel: Network Graph Fragility Analysis},
  year    = {2026},
  url     = {https://github.com/rhoekstr/gravel},
  version = {3.1.0}
}
What Gravel is not
Not turn-by-turn
Not a navigation library. Use OSRM or GraphHopper for directions.
Not transit
Not a multi-modal trip planner. Use OpenTripPlanner for GTFS.
Not dynamic
Contraction hierarchies assume a static edge set. No live traffic, no mutable graphs.
Also from Awry Labs
Kindling takes the same shape to a different problem: a Python API
over a fast native core (Rust there, C++ here), closed-form math instead of a training loop.
It's a hybrid recommender that grows with your data.